CHIffordable
What it does
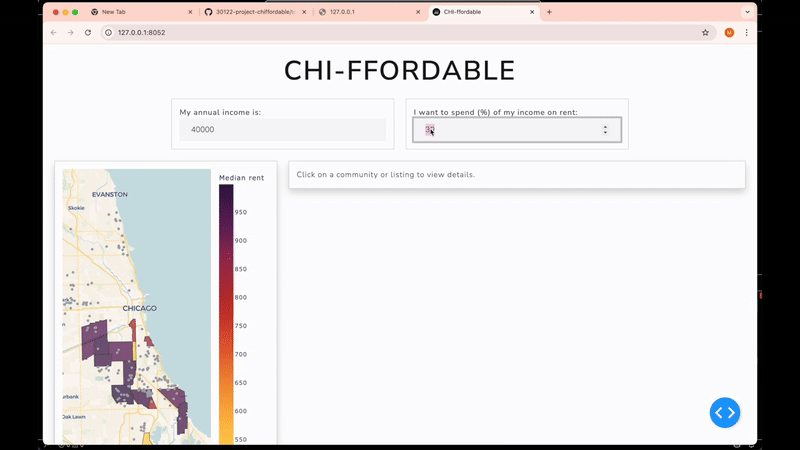
This project seeks to identify places where low-income families can afford rental housing within a specified income and a percentage of their income they are willing to spend on rent. Leveraging data analysis and geospatial mapping, it will also explore these neighborhoods’ demographic, economic, and social characteristics. The findings aim to provide actionable insights for policymakers and community stakeholders, offering a comprehensive resource for addressing Chicago’s affordable housing crisis.
Why I made it
The city of Chicago has identified “an affordable housing gap of around 120,000 homes and 240,000 rental units”, 42% of its residents are burdened by housing costs that exceed 30% of their income and “22% pay more than half of their income”.
Tools & Technologies
- Feature extraction: httpx, regex, lxml, re
- Geospatial analysis: shapely, geopandas
- Data Visualization: folium, plotly
- App Development: dash, webbrowser
What I learned
- How to integarte data from different sources with non-standardized formats.
- How to effectively tell a story using data.
- Building full pipelines for data science projects.
- Creating interactive apps with an html front-end and hosted using Dash.
Real-world use / impact
Produced interactive maps showing distribution of affordable housing in Chicago. Identified underserved areas. This project has the potential to support policy advocacy or community planning.
Team
Built alongside Daniela Ayala, Agustín Eizaguirre, and María José Reyes as a final project of the CAPP122 Computer Science with Applications 2 class.
🔗 Code
View on GitHub