Tax Collection Dashboard
What it does
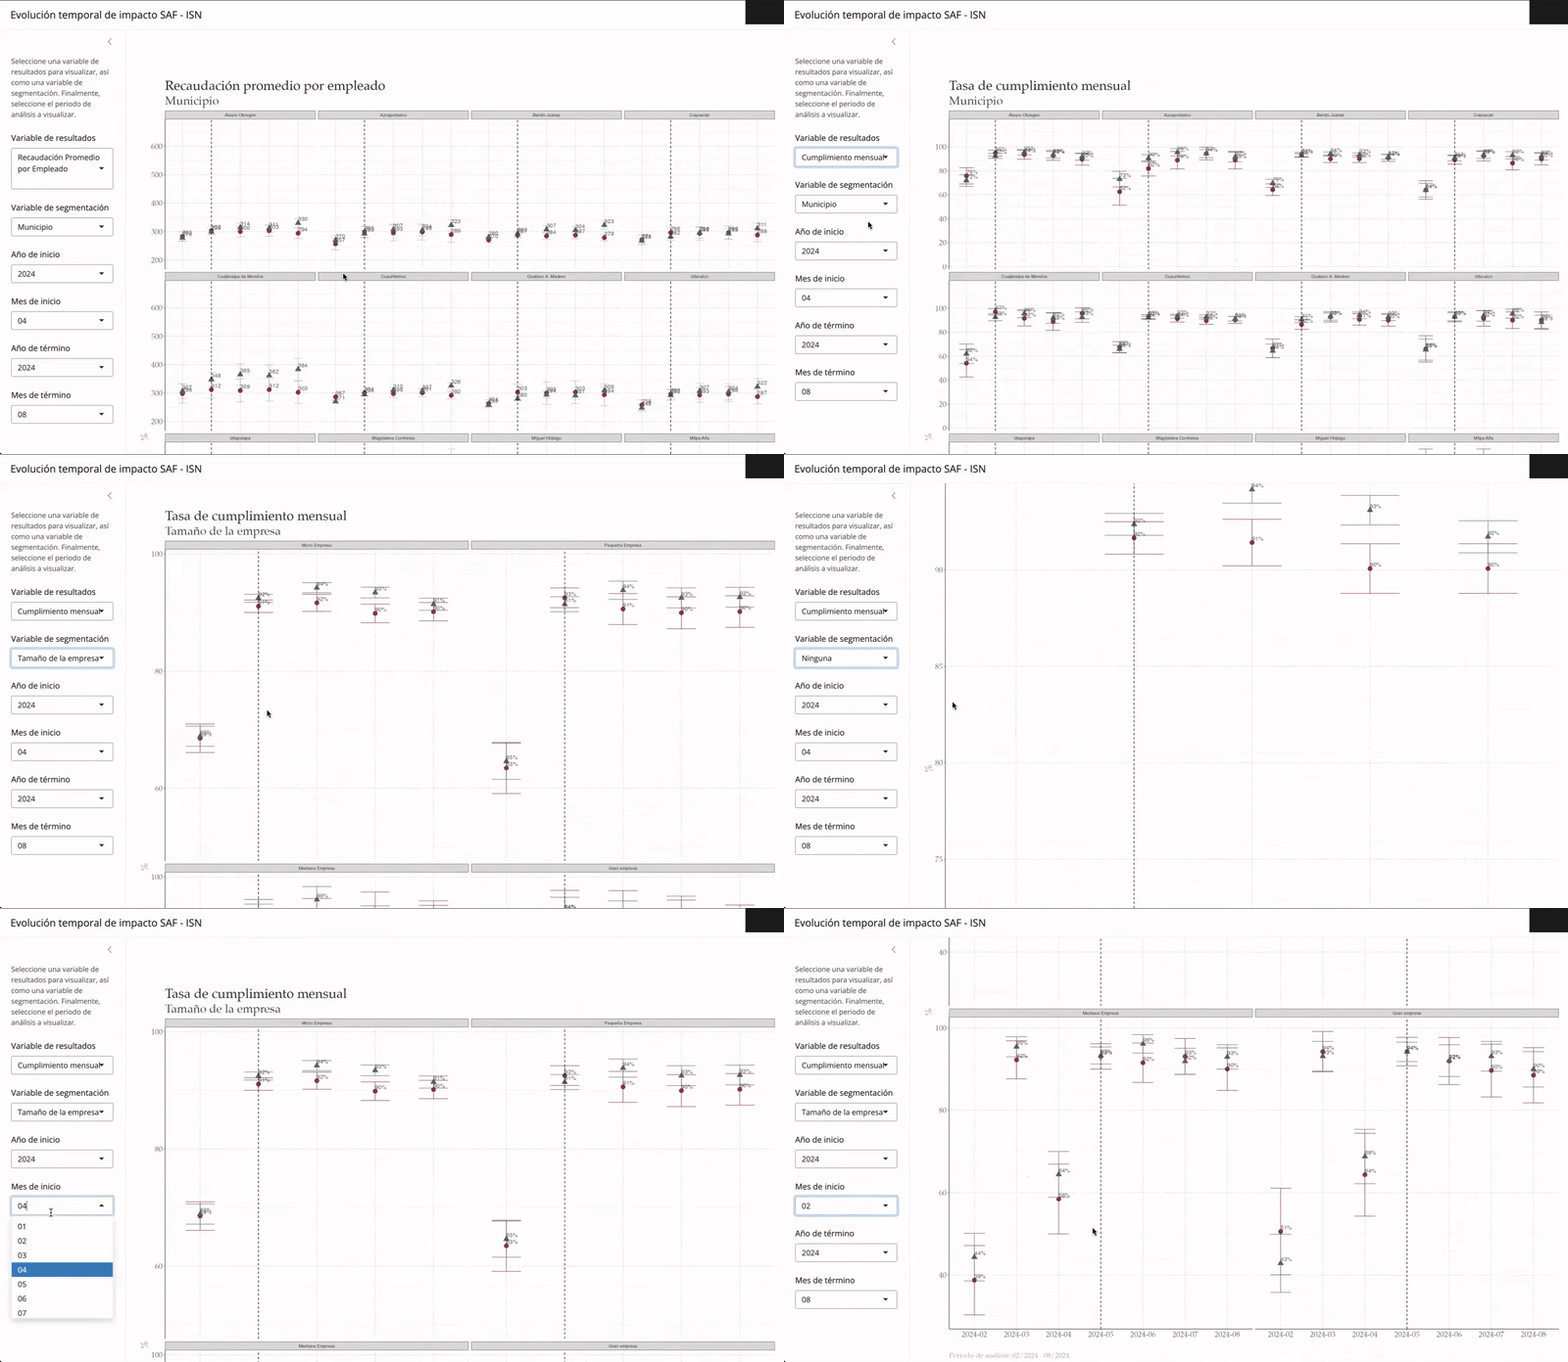
I developed an interactive data visualization dashboard to explore and monitor tax compliance among registered businesses in Mexico City. Built primarily in R using Shiny and ggplot2, the tool is composed of four components, each designed to serve a different analytical purpose.
- Specific Variable Visualization: this module allows users to graphically explore individual tax-related variables based on official administrative data. Users can also seggregate results by business size, legal entity type and municipality. Users can also specify the start and end month/year of the analysis period through a menu interface.
- Control table: this section provides a table of descriptive statistics for the outcome variables over a selected time period. Unlike Component 1, the set of variables is fixed, but users can still apply segmentation and time filters.
- Treatment effect visualizations: This module focuses on experimental results, displaying average outcomes by treatment condition based on a randomized controlled trial (RCT) of communication interventions.Visualizations show weighted averages by treatment group, and users can segment the results by business size or municipality.
- Temporal Impact Evolution: This final module visualizes treatment-control differences over time, helping to identify month-by-month intervention effects. Users can monitor trends through difference-in-means or difference-in-proportions charts across several months.
Why I made it
This project was an opportunity to apply data science and experimental design to a real-world policy issue: improving tax compliance in one of the largest urban economies in Latin America, Mexico City. By visualizing granular administrative data and enabling interactive exploration, the dashboard empowers public officials to detect behavioral patterns—such as underreporting or late payments—and take evidence-informed action.
I joined the initiative to sharpen my skills in building user-friendly analytics tools for government stakeholders. Working closely with the city’s finance department gave me firsthand experience designing for non-technical users, navigating complex public data, and translating insights into operational strategies.
Tools & Technologies
- R – for data processing, statistical modeling, and visualization
- Shiny – to build the interactive dashboard interface
- ggplot2 – for creating high-quality and customizable plots
- dplyr and tidyr – for data manipulation and cleaning
- readr – for importing large administrative datasets efficiently
- Git – for version control and collaborative development
- HTML/CSS (via Shiny) – to customize the UI elements of the app
What I learned
Key takeaways include:
-
Designing with messy public data in mind. I gained hands-on experience cleaning and validating administrative tax records, dealing with missing fields, zero-inflated variables, and inconsistencies across reporting periods.
-
Experimental data needs thoughtful visualization. Communicating treatment effects to non-technical stakeholders taught me how to represent uncertainty, ensure correct group comparisons, and simplify statistical outputs without losing rigor.
-
Iterative collaboration improves tools. By working closely with policymakers and analysts at the Secretaría, I refined the dashboard through feedback loops—enhancing usability and surfacing the most policy-relevant insights.
Real-world use / impact
The dashboard was used by analysts and decision-makers at Mexico City’s Secretaría de Administración y Finanzas to monitor compliance patterns across boroughs and business types. It helped:
- Identify high-risk segments with consistent underreporting behavior, guiding audit prioritization.
- Track the impact of behavioral interventions (e.g., reminder messages) in real time, month by month.
- Produce reports for internal policy meetings using standardized visual outputs.
- Inform future campaigns for taxpayer education and digital outreach, targeting low-compliance zones.
- The tool remains a reference point for ongoing fiscal policy experiments and monitoring initiatives.
Team
Built under the supervision of Phd. Hernán Bejarano and Phd. Lysandra Elyne.
🔗 Code
Private Repo
